![]()
USER GUIDE
Introduction
This manual is a (very synthetic) technical documentation about the content of AFRIMOVE database for the project partners. It illustrates the characteristics of the AFRIMOVE e-infrastructure and the data processing steps (acquisition, harmonization, quality check). It provides a very general overview of the main features of relational databases for they who do not have any background in data management. It also describes the data that are stored in the AFRIMOVE database and how they are organized, with the description of each table and field stored in the database.
Note that this is not a comprehensive manual about database. It shortly introduces the AFRIMOVE database content and the main operations that can be done on it. For an introduction to the database language (Structured Query Language, SQL) you can explore one of the many online tutorials. In particular, the training material of the course “Dealing with Spatio-temporal Data in Movement and Population Ecology”, June 17-22 2018 - Trento, Italy, which is specifically tailored on movement data (and that uses the same database structure as AFRIMOVE).
Other open tutorials, guides and courses available on the web are for example:
For an introduction to PostGIS (the spatial extension of PostgreSQL), you can give a look here:
In addition, for they who want to understand the technicalities of (or replicate) the AFRIMOVE database structure and tools or to get more skills on data management for wildlife tracking data, we suggest the book Spatial Database for GPS Wildlife Tracking Data- A Practical Guide to Creating a Data Management System with PostgreSQL/PostGIS and R (Urbano & Cagnacci Ed., 2014). Contact the AFRIMOVE coordinator if you want a digital version of the chapters of the book (for AFRIMOVE partners).
AFRIMOVE database manager (Ferdinando) and data curators (Melinda and Victoria) are always available for AFRIMOVE database users whenever technical support is needed. For example for:
- preparation of data before they are sent to EURODEER for uploading to the shared database
- creation/management of users
- advanced manipulation of data, specially for research connected with AFRIMOVE papers
- use of environmental data or integration of new ancillary data sets
- questions on data content
- fix of data errors
- export of data in a format more familiar to AFRIMOVE partners
The AFRIMOVE spatial databases is hosted at Edmund Mach Foundation.
More information on the project, including activities, partners, outcomes and news can be found at the AFRIMOVE website.
The participation to the project and the use of the data stored in the database is ruled by the Terms of Use signed by each partner. It is a kind of gentlemen agreement mainly based on good sense. The most important point is “[…] The Partners maintain full property and control of their own dataset […]”. No ownership is transferred and data are used only if data owners explicitly authorize it for each specific research. This also mean that data are not open to the public. But the network is open to any interested scientist.
The content of this guide is largely derived (and adapted) from the EURODEER project user guide.
Database Overview
The main goal of AFRIMOVE project is to join and harmonize tracking data of African wildlife and additional information from different research groups located in different countries in a common data repository. To achieve this goal, we set up a software platform that enables all partners to access, manage and analyze the shared data in a cost-effective fashion. The main requirements of the project and the assessment of possible solutions are described in the paper Wildlife tracking data management: a new vision (Urbano et al., 2013).
The main technical result is a relational database management system with a spatial extension, built on the open source software PostgreSQL (at 2018, version 9.5) and PostGIS (at 2018, version 2.5). It also includes the extension Pl/R that allows the integration of R tools into the database. The AFRIMOVE database is physically installed on a server at Edmund Mach Foundation, but it is accessible from everywhere in the world (by users with a registered account). It works as a centralized server that sends data, when requested, to client applications. A client is a software that accesses the remote service (database) stored on another computer system (server), by way of a network; the client application can be located anywhere and multiple connections to the database can be managed at the same time. Example of client applications are those used to manage the data (e.g., pgAdmin, phpPgAdmin), visualize spatial information (e.g., QGIS, ArcGIS) or perform analysis (e.g., R).
The server-client structure of the system offers the opportunity to build a very flexible and modular software platform, as any software able to connect to the central database can be integrated. Storing, managing, accessing and analysing GPS data from several research groups throughout Europe is thus possible, while each researcher can use its favourite software application, preserving the consistency of the data and avoiding data duplication with connected risk of errors. The most used applications to interact with the AFRIMOVE database are Desktop GIS, statistics and Web tools, as well as office suites.
In the document Database connection you can see some of these applications and how to connect them with the AFRIMOBE database, while in Database Content and Database Objects Description you can explore database structure and content.
In this section, you find an overview of the whole process from data acquisition to data ingestion into the AFRIMOVE database, with a very short introduction to the main features of relational database.
AFRIMOVE data work flow
Data collection
Data stored in the afrimove_db is collected by project partners who fully own the data. No data are collected by AFRIMOVE project itself, which is instead a project to share data of individual institutions.
Data harmonization
A challenging part in the creation of the afrimove_db is the harmonization of data sets from different sources. First of all, it is necessary to identify a set of information that are collected by all (or at least most of) the partners. Then, even when the information is related to the same objects phenomena, it can be collected, coded or stored in different ways (e.g., sampling methods, units, classes). The data is processed to speak “the same language”. In some cases this requires the aggregation of the original data, but this is the only way to run analysis over different areas and environmental gradients.
Particularly, data owners are asked (with the support of the AFRIMOVE data curators) to format the data in order to be consistent with the afrimove_db. Then, it is up to the database manager and data curators to process data and upload into the database.
Quality checks
Tracking data (and in general wildlife monitoring data) can potentially be affected by a large set of errors in different steps of data acquisition and processing. Erroneous data can heavily affect analysis, leading to biased inference and misleading wildlife management/conservation suggestions. Data quality assessment is therefore a key step in AFRIMOVE data management. In fact, a key step in the upload of data from partners to the shared database is quality check. Even if data are supposed to be quality checked by data owners, thanks to the procedures and protocols implemented into the database (and to the functionalities available in a proper database vs other simpler way to store data), many potential errors and inconsistencies are detected when screened by data curators. The errors are then reported to data owners who provide the information to fix them, in an iterative process that might require several steps. No data is removed from the data set. Erroneous information are flagged as such keeping the synchronization with the original data set. While in some cases incorrect data are evident, in many situations, it is not possible to clearly identify information as outliers (even by they who collected the information) because although they are suspicious they might still be correct, leaving a margin of uncertainty. In this case a specific flag is used so data can be excluded from analysis, according to the criteria defined in each case.
The continuous quality check, not only through automated algorithms, is a distinctive trait of the AFRIMOVE approach as compared to other larger shared repository. And this is because quality of scientific output is the main concern of the project.
A very short introduction to database for data management
Database and spatial database
A database is an application that can store and manage a large amount of data very efficiently and rapidly. The relational bit refers to how the data is stored in the database and how it is organized. In a relational database, all data is stored in tables. These have the same structure repeated in each row (like a spreadsheet) and it is the relations between the tables that make it a “relational” table.
The use of a RDBMS has several advantages.
- It has a persistent and very large data storage capability.
- GPS data can be linked to complex spatial and non-spatial data in a common data structure.
- Multiple users can simultaneously access to data with different permissions levels.
- It has the ability to manage different time and spatial reference systems in the same frame.
- It has fast data search and retrieval capabilities.
- It supports controls on data consistency and reduce errors.
- It can implement automated procedures to receive, screen, and store data from GPS telemetry devices.
Spatially enabled relational database management systems (also called “spatial database”, “Spatial Relational DataBase Management System - SRDBMS”, “geodatabase”) are database designed to store, query, and manipulate spatial data. The main advantage of SRDBMS, as compared to flat file based spatial data storage, is that they let a GIS build on the existing capabilities of RDBMS. This includes support for SQL and the ability to generate complex geospatial queries. While traditional GIS are focused on advanced data analysis and visualization, providing a rich set of spatial operations, on few data; spatial databases allow simple spatial operations which can be efficiently undertaken on a large set of elements. This approach suits perfectly the peculiarities of GPS data. Spatial database and GIS software can be integrated in the EURODEER platform, to take advantages of both approaches.
SQL
The database support SQL language. SQL is short for Structured Query Language and is a simple language that provides instructions for building and modifying the structure of databases and, most importantly for EURODEER users, for retrieving and modifying the data stored in the tables.
SQL commands have a syntax similar to the common language. They begin with a command statement describing the action to take (e.g. SELECT), followed by a clause that describes the target of the command (such as the tables affected by the command) (e.g. FROM) and finally, a series of clauses that provide additional instructions that usually specify the subset of data needed by the users (WHERE).
An example is :
SELECT animal_id FROM main.animal WHERE sex = 'f';
The information returned is the animals_id stored in the table main.animals (i.e. name of the schema + “.” + name of the table) for all those individuals that are female.
The SELECT clause specifies one or more columns to be retrieved; to specify multiple columns, use a comma and a space between column names. To retrieve all columns, use the wild card * (an asterisk).
The FROM clause specifies one or more tables to be queried. Use a comma and space between table names when specifying multiple tables.
The WHERE clause selects only the rows in which the specified column contains the specified value. The value is enclosed in single quotes when it is a text.
The semicolon (;) is the statement terminator.
SQL is not case sensitive (i.e., SELECT is the same as select).
Although there are different dialects of SQL, it is very standardized and the same syntax can be used with minimal changes in most of the commonly used database platform (both commercial and open source).
There are many (but not too many) other SQL commands to retrieve data (e.g. order by, limit, left/right join, group by, having) and a long list of useful functions to deal with the different data types. Some resources where you can learn more about SQL are suggested in the Introduction.
The training material of the course “Dealing with Spatio-temporal Data in Movement and Population Ecology”, June 17-22 2018 - Trento, Italy, is specifically tailored on movement data and makes use the same database structure as AFRIMOVE, so it can be a useful reference.
Main database objects
- Schemas. A database contains one or more named schemas, which in turn contain tables. Schemas also contain other kinds of named objects, including data types, functions, and operators.
Schemas are used to organize database objects into logical groups, to make them more manageable, and to allow many users to use one database without interfering with each other. Schemas are similar to folders in a file system. - Tables. The table is where all the data in a database is stored.Each table is made up of rows and columns. Each row in a relational is uniquely identified by a primary key. This can be by one or more sets of column values. Every relational table has one primary key. Its purpose is to uniquely identify each row in the database. Columns are defined to hold a specific type of data, such as dates, numeric, or textual data. A table has a specified number of columns, but can have any number of rows.
- Data type. Each column in a table is associated to a data type that specify the kind of information that can stored (e.g. integer, float, text, date, polygons) and therefore the type of operations that can be performed on it (e.g. sum, division, concatenation, calculation of time interval, calculation of an area).
- Indices. An index is an optional structure, associated with a table, that can speed data access in a similar way an index in a book can help to find faster the information you are looking for (if the index refers to useful information in your search criteria).
- Constraints. Constrains define certain properties that data in a database must comply with. Common kinds of constraints are:
- primary key - value(s) in specified column(s) must be unique for each row in a table and not be NULL; normally each table in a database should have a primary key - it is used to identify individual records
- foreign key - value(s) in specified column(s) must reference an existing record in another table (via it’s primary key or some other unique constraint)
- not null - each value in a column must not be NULL
- unique - value(s) in specified column(s) must be unique for each row in a table
- check - an expression is specified, which must evaluate to true for constraint to be satisfied
- Triggers. A trigger is a specification that the database should automatically execute a particular function whenever a certain type of operation is performed on a particular table in the database. The trigger fires a specific function to perform some actions BEFORE or AFTER records are DELETED, UPDATED, or INSERTED in a table. The trigger function must be defined before the trigger itself is created. The trigger function must be declared as a function taking no arguments and returning type trigger. For example, when you insert a new record in a table, you can modify the values of the attributes before they are uploaded or you can update another table that should be affected by this new upload.
- Views. A view is the result set of a stored query on the data, which the database users can query just as they would in a persistent database collection object. This pre-established query command is kept in the database dictionary. Unlike ordinary base tables in a relational database, a view does not form part of the physical schema: as a result set, it is a virtual table computed or collated dynamically from data in the database when access to that view is requested. Changes applied to the data in a relevant underlying table are reflected in the data shown in subsequent invocations of the view.
- Functions. A function is a program code that is implemented inside the database using SQL or a set of other languages (e.g. PSQL, Python, C). Functions allow you to create complex processes and algorithms when plain SQL queries alone cannot do the job. Once created, a function becomes part of the database library and can be called inside SQL queries.
- Domains. A data domain refers to all the values which a data element may contain. The rule for determining the domain boundary may be as simple as a data type with an enumerated list of values. Domains can help to keep the integrity of the database restricting the accepted values to a set of valid options. A domain can be implemented as list of values stored in the so-called look up table or as a constraint (check) to the specific column. The data type per se limit the set of accepted values (e.g. an integer cannot accept character as valid value).
- Users. In a database, multiple users can access data at the same time, and the database server manage the different requests and ensure the consistency of the data. Each user can be associated to different permission levels on different database objects. For example, a defined user can edit and even delete some tables, while can only visualize some other tables or have no access at all on others. The database administration has full control of all database objects. Permissions can also be associated with user groups, in which case new users can be added to each group and will inherit all the related permissions on database objects.
Data modelling
Data models are the logical core of DBMSs and allow linking and integration of data sources by means of complex relationships; this is not only necessary for consistently structuring the database, but is also an extremely useful way to force users to clarify the ecological/biological relational links between groups of data.
As database systems grow in size and complexity, and user requirements get more sophisticated, (spatial) data modelling becomes more important. A data model in a database framework (typically, relational or object-relational) describes what type of data are stored and how they are organized. It can be defined as a conceptual representation of the real world in database structures that include data objects (i.e. tables), associations between data objects, and rules that govern operations on the objects, thus explicitly determining their spatial and non-spatial relationships.
Data modelling permits easy update, modification and adaptation of the database structure to accommodate changing goals, constraints and spatial scales of studies, and the evolution of wildlife tracking systems. Without a rigorous data modelling approach, an information system might lose the flexibility to manage data efficiently in the long term.
Why open source software
Although any application that support standard database connection can be used with the EURODEER software platform, the database itself and many powerful applications (e.g., R, QGIS) are open source. Open source software tools were selected, first of all, because there are no resources available to buy software licences. More importantly, we decided to use PostgreSQL/PostGIS because open source tools in the domain of spatial data management and analysis are efficient, powerful and able to support a web-based multi-user environment. They meet all the requirements raised in the requirement analysis as they offer a complete set of software to efficiently implement ecological applications. Another core characteristic of open source tools relevant to the project is the use of standards, specially in the case of database software, that ensure interoperability and thus enable all the project’s participants to connect the database with a large set of client applications with no need to buy specific software to exploit the shared information. Adopting international data and metadata standards is the only way to ensure interoperability between different information systems, both within and outside a single organization.
Database content
The AFRIMOVE database is the repositories where data coming from the different partners of the AFRIMOVE network are harmonized, stored and shared to be analyzed. The first goal of AFRIMOVE is to investigate variations in roe deer behavioural ecology along environmental gradients or population responses to specific conditions, such as habitat changes, impact of human activities, different hunting regime. Therefore, the main set of data stored into the database are those generated by biotelemetry sensors to monitor animals movement, particularly:
- GPS data
- VHF data
- Accelerometer data
These are the core information that are collected and shared in the AFRIMOVE framework. But while these data sets provide a huge mine of data to dig, it is when they are couple with additional information like that of the individuals, populations, management regimes and the environment that they can help to fully decipher the mechanisms of animals movement. This is why we aim at collecting also these additional information from each partner, harmonize them and integrate into the analysis. This is a complex process but ultimately it is the biggest added value of the collaboration among scientist on top of the integration into a single repository of the data coming from sensors. The work of data harmonization requires long and iterative discussions but it is also an opportunity to identify good practice (e.g. data collection protocols) that can then be shared with a wider scientific community.
Sensor data sets (GPS, VHF, accelerometer) in addition to the measures collected by the sensors include the list of animals (with key attributes like sex, age and how hey died), the list and type/model of sensors, and the start and end of sensor deployment (with the reason for the end of deployment).
Here below is reported a simplified ER diagram. It illustrates the main tables and views and the relations among the tables.
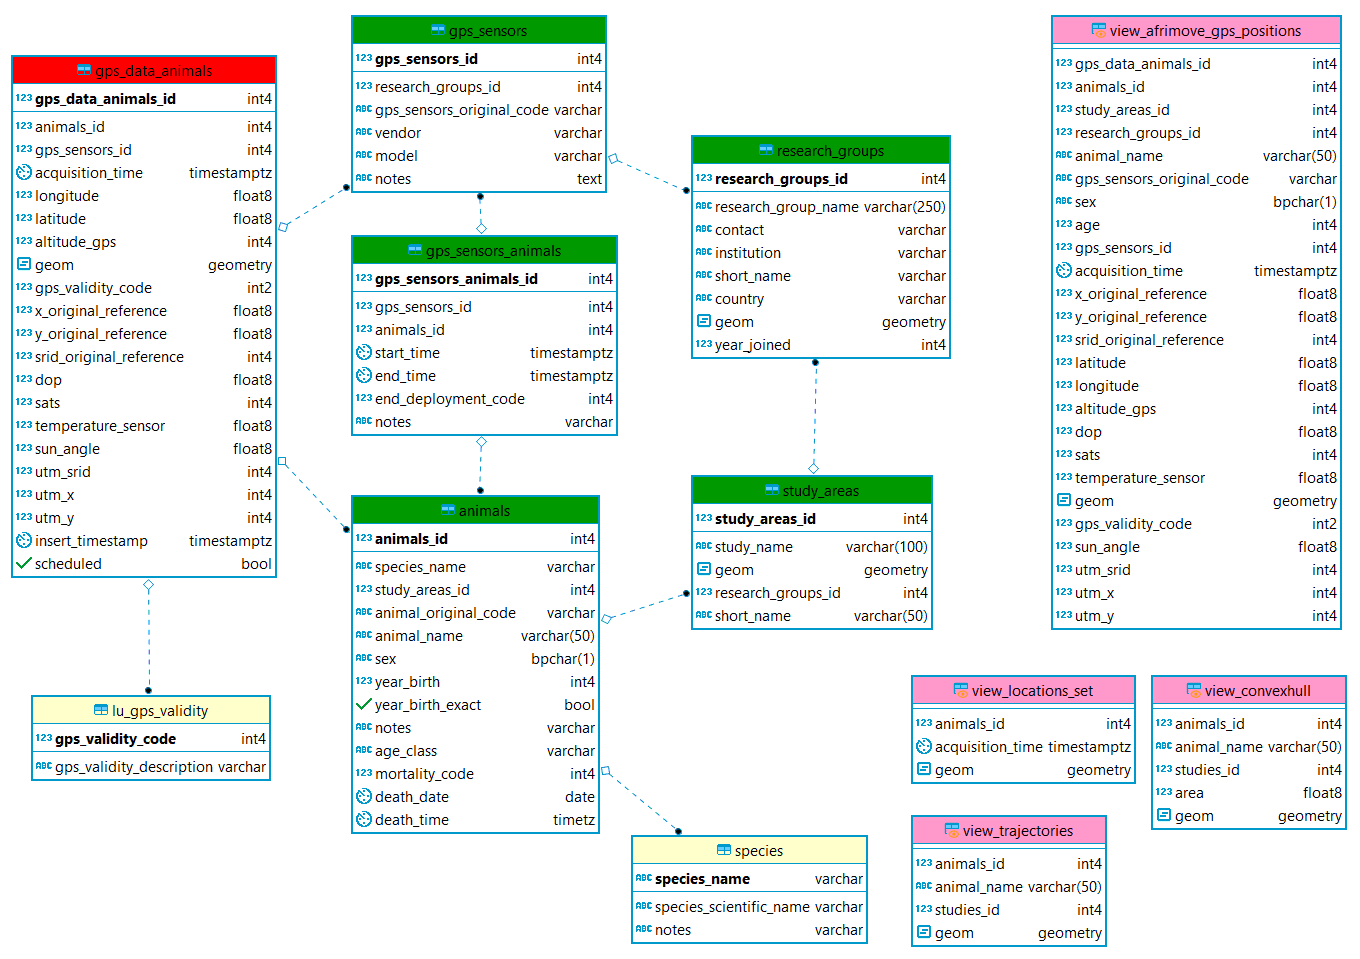
A short description of the information content of these data sets is reported in the next sub-sections together with a diagram of the data model.
All the core information is stored in the schema main, with the exception of the environmental data that are available in the schema env_data and the schema env_data_ts (for layers with a time series, e.g., NDVI and snow). In the schema tools there are the functions created to process and analyze the data. The schema analysis is used to store informations related to analysis that can be reused by all partners. The working schema ws_* are spaces where each partner institution can create table and process the data (one per institute). Finally, in the lu_tables schema, the database stores all the look up tables, i.e., those tables used to define (code) a valid domain of values for specific fields (e.g., the list of capture methods).
Research groups, study areas and sub-areas
Sensor data are always related to animals. Each animal is assigned to one (and only one) study area. Each study area belongs to (is monitored by) a research group. The same research group can have more than one study area. Sensors (GPS, VHF, accelerometer) are attributed to a specific research group.
GPS data
GPS locations are stored already associated to animals (which is a non-trivial step, specially when the same sensor is associated to different animals once recovered from the previous one). The locations, with a list of derived ancillary information calculated using the information on coordinates and acquisition time, and intersecting with environmental layers are stored in the table main.gps_data_animals. The original file coming from the sensor is not stored in the db as in the database are shared data already preprocessed by the partners and only quality checked before being uploaded. It is important to note that all the outliers are not removed from the dataset but flagged using the field gps_validity_code. This includes, among the others, records with no coordinates, records with wrong coordinates, record with suspicious coordinates, records not registered while the sensor was deployed on the animal. When data are analyzed, records must be selected according to the quality level required by the specific analysis.
The information on the deployment are stored in the table main.gps_sensors_animals, including the reasons of the end of the deployment. This table is used to check the correct attribution of locations to animals in the table main.gps_data_animals. Information on sensors are stored in main.sensors, while the information on animals in main.animals. A set of look up tables are used to store the list of valid values for some columns of these tables.
In the views analysis.view_convexhull and ** analysis.view_trajectories** are available the trajectories and convex hull polygons related to each animal (and dynamically updated). These can be loaded in QGIS for spatial visualization. In the view analysis.view_ltraj_class data are formatted according to R adehabitat package to facilitate the import for analysis.
Environmental data
WORK IN PROGRESS
Database Objects Description
Every single object in the afrimove_db (schemas, tables, columns, views, functions) is described inside the database (as comment). The descriptions are visible in all db interface (e.g., pgAdmin) when the element is selected.
Here you can see a short report that includes the description of the objects of the database (schema, tables, columns) in markdown format, taking the comments from the database itself.
SCHEMA: main
The schema “main” is the place where all the core information of the main objects are stored: data from sensors (at the moment, GPS, VHF, activity), sensors, animals, studies, research groups.
TABLE: main.animals
Table with the information on the animals.
COLUMNS
- animals_id [integer]: Database id of population. Each animal belongs to a population, which is part of a study area. The same study area can have multiple populations. Linked with the table main.populations.
- species_name [character varying]: Name of the species of the individual.
- study_areas_id [integer]: Study area where the animal is located (reference to table main.study_area).
- animal_original_code [character varying]: Identifier of the animal in the original data set.
- animal_name [character varying]: Nome of the animal in the original data set.
- sex [character]: Code for sex. It can be either “f” (female) or “m” (male). When the sex is not known, the field can be left empty.
- year_birth [integer]:
- year_birth_exact [boolean]:
- notes [character varying]: Open field where general notes on the animals can be added.
- age_class [character varying]: Age class of the animal (e.g. adult). This information is not coded as the age class might vary according to the species.
- mortality_code [integer]:
- death_date [date]:
- death_time [time with time zone]:
TABLE: main.gps_data_animals
Table with GPS locations data associated to animals and with a list of derived ancillary information calculated using the information on coordinates and acquisition time, and intersecting with environmental layers.
COLUMNS
- gps_data_animals_id [integer]: Eurodeer identifier for the location.
- animals_id [integer]: Eurodeer identifier for the animal.
- gps_sensors_id [integer]: Eurodeer identifier for the GPS sensor.
- acquisition_time [timestamp with time zone]: Date and time of acquisition of the GPS coordinates (with time zone).
- longitude [double precision]: Longitude recorded by the GPS sensor.
- latitude [double precision]: Latitude recorded by the GPS sensor.
- altitude_gps [integer]: Altitude recorded by the GPS sensor (related to the centre of the earth).
- geom [USER-DEFINED]: Geometry of the location (point).
- gps_validity_code [smallint]: This field tags the record according to its “validity” or degree of reliability (explanation of codes in lu_tables.lu_gps_validity).
- x_original_reference [double precision]: Coordinate X as computed by the software connected to the GPS sensor (in the srid_original_reference).
- y_original_reference [double precision]: Coordinate Y as computed by the software connected to the GPS sensor (in the srid_original_reference).
- srid_original_reference [integer]: Reference system of the projected coordinates provided by the software connected to the GPS sensor.
- dop [double precision]: Dilution Of Precision.
- sats [integer]: Number of satellites used by the GPS sensor to calculate the coordinates.
- temperature_sensor [double precision]: Temperature as measured by the sensor associated to the GPS.
- sun_angle [double precision]: Sun angle above (or below) the horizon (in degrees) as computed by the function tools.sun_elevation_angle_function.
- utm_srid [integer]: SRID code of the UTM zone of the centroid of the locations for the animal.
- utm_x [integer]: X coordinate projected in the utm_srid UTM zone.
- utm_y [integer]: Y coordinate projected in the utm_srid UTM zone.
- insert_timestamp [timestamp with time zone]: Date and time when the record was uploaded into the database.
- scheduled [boolean]: Some locations might be taken even if they were not scheduled (in this case, the value is FALSE).
TABLE: main.gps_sensors
Catalogue of GPS sensors. Each sensor belongs to a research group. The attributes include the brand and the model. The id used in the original data set is also included.
COLUMNS
- gps_sensors_id [integer]: afrimove identifier for GPS sensors.
- research_groups_id [integer]: Id of the research group that owns the GPS sensor.
- gps_sensors_original_code [character varying]: Identifier of the GPS sensor in the original data set.
- vendor [character varying]: Company that produced the sensor.
- model [character varying]: Additional notes about the GPS sensor.
- notes [text]:
TABLE: main.gps_sensors_animals
Table with the information on the deployments of GPS sensors on animals (starting and ending date and time of the deployment), reason of the end of deployment, reference capture. Here we identify when the sensor stopped to monitor the (alive) animal. So the date is not that of collar recovery (it goes in table animals_contacts, nor the date of death (table animals).
COLUMNS
- gps_sensors_animals_id [integer]: afrimove identifier of the deployment.
- gps_sensors_id [integer]: afrimove identifier of the GPS sensor.
- animals_id [integer]: afrimove identifier of the animal.
- start_time [timestamp with time zone]: Time and date of the start of the deployment.
- end_time [timestamp with time zone]: Time and date of the end of the deployment.
- end_deployment_code [integer]: Code for the reason of the end of deployment (reference to the look up table lu_tables.lu_end_deployment).
- notes [character varying]: Open field where general notes on the deployment can be added.
TABLE: main.research_groups
Research groups are the highest level in the hierarchy of the database. Each research group can have many study areas and can own many collars.
COLUMNS
- research_groups_id [integer]: afrimove identifier for research groups.
- research_group_name [character varying]: Name of the research group.
- contact [character varying]: Contact person of the research group for the afrimove project.
- institution [character varying]: Institute of the research group.
- short_name [character varying]: Short name of the research group.
- country [character varying]: Country of the research group.
- geom [USER-DEFINED]: Approximate location of the research group.
- year_joined [integer]: Year when the group joined the afrimove project.
TABLE: main.species
Table with the list of species monitored by Afrimove partners.
COLUMNS
- species_name [character varying]: Name of the species.
- species_scientific_name [character varying]: Scientific name of the species.
- notes [character varying]: Notes about the species.
TABLE: main.study_areas
Study areas are the areas monitored by research groups. Each study area can have many animals. Study areas can have defined, approximated, or no specific spatial boundaries.
COLUMNS
- study_areas_id [integer]: afrimove identifier for study areas.
- study_name [character varying]: Name of the study area.
- geom [USER-DEFINED]: Multi polygons layer of study areas. This spatial layer can be used as a reference to locate the study areas. Study areas can have defined boundaries (e.g. fenced). In this case, the field “defined_bundaries” is set to 1. Otherwise a reference boundary is created as the convex hull polygon (plus a buffer of 1 km) of the existing locations. These boundaries should be updated whenever a new set of locations is uploaded in the database.
- research_groups_id [integer]: Indentifier of the research group that is monitoring animals in this study area.
- short_name [character varying]: Short version of the study area name for maps and short reports.
VIEW: main.view_afrimove_gps_positions
Animal locations with valid coordinates and information on animals (study area, research group, age and sex).
VIEW: main.view_afrimove_gps_positions_check_shp
Animal locations with valid coordinates and information on animals (study area, research group, age and sex) formatted to be exported as shp (names shorter than dbf limits).
VIEW: main.view_afrimove_gps_positions_r
Animal locations with valid coordinates and information on animals (study area, research group, age and sex) formatted to be exported in R.
VIEW: main.view_afrimove_gps_positions_shp
Animal locations with valid coordinates and information on animals (study area, research group, age and sex) formatted to be exported as shp (names shorter than dbf limits).
VIEW: main.view_convexhull
View with the convex hull of all valid locations per all the animals of afrimove dataset.
VIEW: main.view_locations_set
View that returns the core information of locations data (id of the animal, the acquisition time and the geometry). Non valid records are represented without the geometry. Duplicated timestamps and wrong locations are excluded.
VIEW: main.view_trajectories
Complete trajectories as linear spatial features per each of the animals of afrimove dataset.
SCHEMA: lu_tables
The schema “lu_tables” is where the look up tables (lu_tables) are stored. These tables store the list and the description of codes referenced by other tables in the database and are a kind of valid domain for specific fields.
TABLE: lu_tables.lu_end_deployment
Look up table for end_deployment_code field: it specifies the meaning of the code used to identify the reasons of the end of deployment.
COLUMNS
- end_deployment_code [integer]: Code for the reason of the end of deployment.
- end_deployment_description [character varying]: Desciption of the reason of the end of deployment.
TABLE: lu_tables.lu_gps_validity
Look up table for GPS locations validity.
COLUMNS
- gps_validity_code [integer]: Code of the GPS locations validity.
- gps_validity_description [character varying]: Description of the GPS locations validity code.
TABLE: lu_tables.lu_mortality
Look up table for mortality_code field (table main.animals_contacts): it specifies the meaning of the code used to identify the reasons of the death of the animal.
COLUMNS
- mortality_code [integer]: Code for the reason of the death of the animal.
- mortality_description [character varying]: Desciption of the reason of the death of the animal.
TABLE: lu_tables.lu_temperature_validity
Look up table for temperature locations validity.
COLUMNS
- temperature_validity_code [integer]: Code of the temperature validity.
- temperature_validity_description [character varying]: Description of the temperature validity code.
SCHEMA: tools
The schema “tools” hosts all the functions and tools that are used throughout the database to manage, massage, analyse and query data.
SCHEMA: temp
This schema stores temporary objects (tables, functions, …) used for analysis or for testing purposes. Elements stored in this schema can be deleted at any time by the database administrator.
SCHEMA: public
standard public schema
SCHEMA: ws_cnrs
Working schema for members of CNRS. This can be used to create any object they need for their studies. No other users will have access to this schema.